1장 데이터에서 인사이트 발견하기 - 멕시코풍 프랜차이즈 chipotle의 주문 데이터 분석하기 [이것이 데이터 분석이다]

∣
2023년 11월 17일
먼저 질문 리스트를 작성한다. 무엇이 가장 많이 판매됐을때 메뉴별 판매량은 어떨까? 그 후 질문 리스트에 개한 분석 결과를 시각화하며 분석을 한다.
타이틀을 누르면 데이터가 있는 깃허브 주소로 이동한다.
먼저 데이터를 판다스 데이터 프레임으로 불러온다. 탭단위로 정보를 읽는다. 그 후 데이터 모양과 기초 정보를 조회한다.
import pandas as pd

# read_csv 함수로 데이터를 Dataframe 형태로 불러옵니다.
file_path = '../data/chipotle.tsv'
chipo = pd.read_csv(file_path, sep = '\t')

print(chipo.shape)
print("------------------------------------")
print(chipo.info())
(4622, 5)
------------------------------------
<class 'pandas.core.frame.DataFrame'>
RangeIndex: 4622 entries, 0 to 4621
Data columns (total 5 columns):
 #   Column              Non-Null Count  Dtype
---  ------              --------------  -----
 0   order_id            4622 non-null   int64
 1   quantity            4622 non-null   int64
 2   item_name           4622 non-null   object
 3   choice_description  3376 non-null   object
 4   item_price          4622 non-null   object
dtypes: int64(2), object(3)
memory usage: 180.7+ KB
None
데이터 프레임의 처음 10개의 데이터를 조회한다.
chipo.head(10)
| order_id | quantity | item_name | choice_description | item_price | |
|---|---|---|---|---|---|
| 0 | 1 | 1 | Chips and Fresh Tomato Salsa | NaN | $2.39 |
| 1 | 1 | 1 | Izze | [Clementine] | $3.39 |
| 2 | 1 | 1 | Nantucket Nectar | [Apple] | $3.39 |
| 3 | 1 | 1 | Chips and Tomatillo-Green Chili Salsa | NaN | $2.39 |
| 4 | 2 | 2 | Chicken Bowl | [Tomatillo-Red Chili Salsa (Hot), [Black Beans... | $16.98 |
| 5 | 3 | 1 | Chicken Bowl | [Fresh Tomato Salsa (Mild), [Rice, Cheese, Sou... | $10.98 |
| 6 | 3 | 1 | Side of Chips | NaN | $1.69 |
| 7 | 4 | 1 | Steak Burrito | [Tomatillo Red Chili Salsa, [Fajita Vegetables... | $11.75 |
| 8 | 4 | 1 | Steak Soft Tacos | [Tomatillo Green Chili Salsa, [Pinto Beans, Ch... | $9.25 |
| 9 | 5 | 1 | Steak Burrito | [Fresh Tomato Salsa, [Rice, Black Beans, Pinto... | $9.25 |
print(chipo.columns)
print("------------------------------------")
print(chipo.index)
Index(['order_id', 'quantity', 'item_name', 'choice_description',
       'item_price'],
      dtype='object')
------------------------------------
RangeIndex(start=0, stop=4622, step=1)
이번에는 수치적 데이터를 조회해본다. 본 과정을 통해 평균 주문량이 1.07이란 것을 확인해볼 수 있었다.
chipo['order_id'] = chipo['order_id'].astype(str) # order_id는 숫자의 의미를 가지지 않기 때문에 str으로 변환합니다.
print(chipo.describe()) # chipo dataframe에서 수치형 피처들의 요약 통계량을 확인합니다.
          quantity
count  4622.000000
mean      1.075725
std       0.410186
min       1.000000
25%       1.000000
50%       1.000000
75%       1.000000
max      15.000000
주문 개수와 아이템 개수를 확인해 봤습니다.
print(len(chipo['order_id'].unique())) # order_id의 개수를 출력합니다.
print(len(chipo['item_name'].unique())) # item_name의 개수를 출력합니다.
1834
50
이제 좀 더 데이터에 다가가 질문을 탐색하며 이를 시각화하는 과정이다.
교재에서는 iteritems()함수를 사용하지만 판다스 버젼에 따라 에러가 발생할 수 있다. 나는 items()를 사용하였다. value_counts() 함수룰 사용하여 요소별 개수를 구해 상위 10개를 출력하는 코드이다.
# 가장 많이 주문한 item : top 10을 출력합니다.

# 'item_name' 열의 각 항목(메뉴 아이템)의 등장 횟수를 세고,
# 가장 많이 주문한 상위 10개 아이템을 선택합니다.
item_count = chipo['item_name'].value_counts()[:10]

# for 루프를 사용하여 상위 10개 아이템의 정보를 출력합니다.
# idx: 순위(1부터 시작), val: 아이템 이름, cnt: 해당 아이템의 주문 횟수
for idx, (val, cnt) in enumerate(item_count.items(), 1):
    # "Top 순위 : 아이템 이름 주문 횟수" 형식으로 출력합니다.
    print("Top", idx, ":", val, cnt)
Top 1 : Chicken Bowl 726
Top 2 : Chicken Burrito 553
Top 3 : Chips and Guacamole 479
Top 4 : Steak Burrito 368
Top 5 : Canned Soft Drink 301
Top 6 : Steak Bowl 211
Top 7 : Chips 211
Top 8 : Bottled Water 162
Top 9 : Chicken Soft Tacos 115
Top 10 : Chips and Fresh Tomato Salsa 110
groupby함수를 사용하여 항목별로 구분한뒤 주문 갯수를 구했다.
# item당 주문 개수를 출력합니다.
order_count = chipo.groupby('item_name')['order_id'].count()
order_count[:10] # item당 주문 개수를 출력합니다.
item_name
6 Pack Soft Drink         54
Barbacoa Bowl             66
Barbacoa Burrito          91
Barbacoa Crispy Tacos     11
Barbacoa Salad Bowl       10
Barbacoa Soft Tacos       25
Bottled Water            162
Bowl                       2
Burrito                    6
Canned Soda              104
Name: order_id, dtype: int64
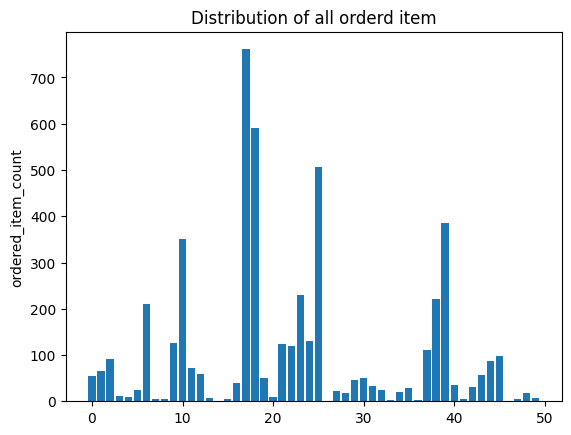
동일하게 총량도 구했다.
# item당 주문 총량을 출력합니다.
item_quantity = chipo.groupby('item_name')['quantity'].sum()
item_quantity[:10] # item당 주문 총량을 출력합니다.
item_name
6 Pack Soft Drink         55
Barbacoa Bowl             66
Barbacoa Burrito          91
Barbacoa Crispy Tacos     12
Barbacoa Salad Bowl       10
Barbacoa Soft Tacos       25
Bottled Water            211
Bowl                       4
Burrito                    6
Canned Soda              126
Name: quantity, dtype: int64
import numpy as np
import matplotlib.pyplot as plt

item_name_list = item_quantity.index.tolist()
x_pos = np.arange(len(item_name_list))
order_cnt = item_quantity.values.tolist()

plt.bar(x_pos, order_cnt, align='center')
plt.ylabel('ordered_item_count')
plt.title('Distribution of all orderd item')

plt.show()
value_counts()는 고유한 값의 빈도를 계산하여 주로 빈도 분포를 확인하는 데 사용되고, unique()는 중복 없이 나타나는 값들을 확인하는 데 사용됩니다.
# value_counts
피자     3
햄버거    3
치킨     2
Name: 음식, dtype: int64
unique
['피자' '햄버거' '치킨']
item_price는 의미적으로 숫자지만 $글자가 앞에 있어 문자임을 확인할 수 있었습니다.
print(chipo.info())
print('-------------')
chipo['item_price'].head()
<class 'pandas.core.frame.DataFrame'>
RangeIndex: 4622 entries, 0 to 4621
Data columns (total 5 columns):
 #   Column              Non-Null Count  Dtype
---  ------              --------------  -----
 0   order_id            4622 non-null   object
 1   quantity            4622 non-null   int64
 2   item_name           4622 non-null   object
 3   choice_description  3376 non-null   object
 4   item_price          4622 non-null   object
dtypes: int64(1), object(4)
memory usage: 180.7+ KB
None
-------------
0     $2.39
1     $3.39
2     $3.39
3     $2.39
4    $16.98
Name: item_price, dtype: object
apply로 해당 시리지 단위의 연산을 시행했다. 데이터를 보면 알 수 있듯이 $ 글자로 인해 바로 float 형 변환이 불가능하다. 때문에 앞에 한글자를 제외한 나머지에 대해서 해당 x를 형변환해 적용하고, 해당 시리즈를 덮어쓰기 한다.
# column 단위 데이터에 apply 함수로 전처리를 적용합니다.
chipo['item_price'] = chipo['item_price'].apply(lambda x: float(x[1:]))
chipo.describe()
| quantity | item_price | |
|---|---|---|
| count | 4622.000000 | 4622.000000 |
| mean | 1.075725 | 7.464336 |
| std | 0.410186 | 4.245557 |
| min | 1.000000 | 1.090000 |
| 25% | 1.000000 | 3.390000 |
| 50% | 1.000000 | 8.750000 |
| 75% | 1.000000 | 9.250000 |
| max | 15.000000 | 44.250000 |
먼저 해당 주문(order_id)별로 그룹화 한다. 그 후 item_price 열에 대해서 각 주문 별 모두 더한 뒤 평균을 구하는 함수를 적용한다.
# 주문당 평균 계산금액을 출력합니다.
chipo.groupby('order_id')['item_price'].sum().mean()
18.811428571428568
먼저 주문별 그룹화를한 뒤 sum 메소드를 활용하여 모두 더했습니다. 그 후 item_price 10 이상인 데이터의 상위 10개만 출력했습니다.
# 한 주문에 10달러 이상 사용한 id를 출력합니다.
chipo_orderid_group = chipo.groupby('order_id').sum()
results = chipo_orderid_group[chipo_orderid_group.item_price >= 10]

print(results[:10])
print(results.index.values)
          quantity                                          item_name  \
order_id
1                4  Chips and Fresh Tomato SalsaIzzeNantucket Nect...
10               2                    Chicken BowlChips and Guacamole
100              2                           Steak BurritoCanned Soda
1000             2                          Barbacoa BowlChicken Bowl
1001             2                           Steak BurritoCanned Soda
1002             2                      Barbacoa BurritoSide of Chips
1003             2                  Carnitas BurritoCanned Soft Drink
1004             2                                       Chicken Bowl
1005             3              Chicken BurritoChipsCanned Soft Drink
1006             8  Chicken Soft TacosVeggie BowlSteak BowlChicken...

                                         choice_description  item_price
order_id
1                                       [Clementine][Apple]       11.56
10        [Tomatillo Red Chili Salsa, [Fajita Vegetables...       13.20
100       [Roasted Chili Corn Salsa (Medium), [Rice, Bla...       10.08
1000      [Roasted Chili Corn Salsa, [Rice, Black Beans,...       20.50
1001      [Fresh Tomato Salsa (Mild), [Pinto Beans, Rice...       10.08
1002      [[Tomatillo-Green Chili Salsa (Medium), Tomati...       10.68
1003      [Tomatillo Red Chili Salsa, [Black Beans, Chee...       13.00
1004      [Tomatillo-Red Chili Salsa (Hot), [Rice, Fajit...       21.96
1005      [Fresh Tomato Salsa, [Rice, Black Beans, Chees...       12.15
1006      [Fresh Tomato Salsa, [Sour Cream, Lettuce]][Fr...       71.40
['1' '10' '100' ... '997' '998' '999']
먼저 quantity가 1인 아이템들을 모두 모았습니다. 그후 해당 객체를 item 이름별 그룹화를 한 뒤 item_price에 맞춰 재정렬 하였습니다.
# 각 아이템의 가격을 계산합니다.
chipo_one_item = chipo[chipo.quantity == 1]
price_per_item = chipo_one_item.groupby('item_name').min()
price_per_item.sort_values(by = "item_price", ascending = False)[:10]
| order_id | quantity | choice_description | item_price | |
|---|---|---|---|---|
| item_name | ||||
| Steak Salad Bowl | 1032 | 1 | [Fresh Tomato Salsa, Lettuce] | 9.39 |
| Barbacoa Salad Bowl | 1283 | 1 | [Fresh Tomato Salsa, Guacamole] | 9.39 |
| Carnitas Salad Bowl | 1035 | 1 | [Fresh Tomato Salsa, [Rice, Black Beans, Chees... | 9.39 |
| Carnitas Soft Tacos | 1011 | 1 | [Fresh Tomato Salsa (Mild), [Black Beans, Rice... | 8.99 |
| Carnitas Crispy Tacos | 1774 | 1 | [Fresh Tomato Salsa, [Fajita Vegetables, Rice,... | 8.99 |
| Steak Soft Tacos | 1054 | 1 | [Fresh Tomato Salsa (Mild), [Cheese, Sour Cream]] | 8.99 |
| Carnitas Salad | 1500 | 1 | [[Fresh Tomato Salsa (Mild), Roasted Chili Cor... | 8.99 |
| Carnitas Bowl | 1007 | 1 | [Fresh Tomato (Mild), [Guacamole, Lettuce, Ric... | 8.99 |
| Barbacoa Soft Tacos | 1103 | 1 | [Fresh Tomato Salsa, [Black Beans, Cheese, Let... | 8.99 |
| Barbacoa Crispy Tacos | 110 | 1 | [Fresh Tomato Salsa, Guacamole] | 8.99 |
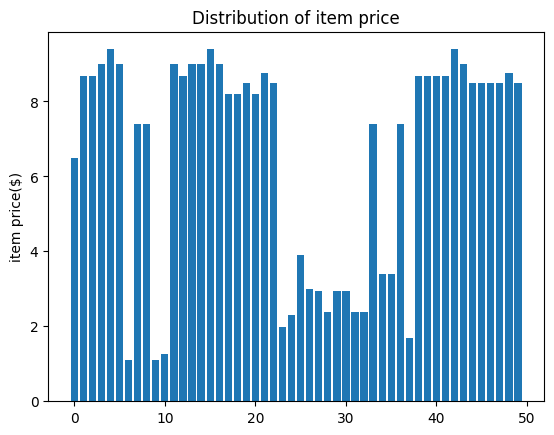
해당 내용을 그래프로 시각화 할 있었습니다.
# 아이템 가격 분포 그래프를 출력합니다.
item_name_list = price_per_item.index.tolist()
x_pos = np.arange(len(item_name_list))
item_price = price_per_item['item_price'].tolist()

plt.bar(x_pos, item_price, align='center')
plt.ylabel('item price($)')
plt.title('Distribution of item price')

plt.show()
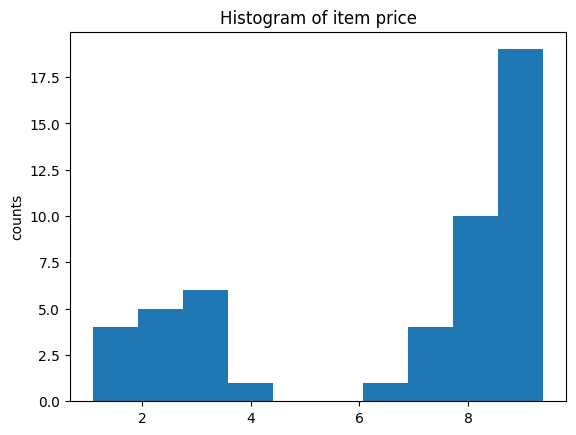
# 아이템 가격 히스토그램을 출력합니다.
plt.hist(item_price)
plt.ylabel('counts')
plt.title('Histogram of item price')

plt.show()
id 별 그룹화 + 합치기를 한 다음 item_price 기준으로 정렬을 한뒤 상위 5개를 출력하였습니다.
# 가장 비싼 주문에서 item이 총 몇개 팔렸는지를 계산합니다.
chipo.groupby('order_id').sum().sort_values(by='item_price', ascending=False)[:5]
| quantity | item_name | choice_description | item_price | |
|---|---|---|---|---|
| order_id | ||||
| 926 | 23 | Steak BurritoChicken BowlChicken BowlChicken B... | [Fresh Tomato Salsa, [Rice, Sour Cream, Lettuc... | 205.25 |
| 1443 | 35 | Chips and Fresh Tomato SalsaBottled Water6 Pac... | [Coke][Fresh Tomato Salsa, [Fajita Vegetables,... | 160.74 |
| 1483 | 14 | Chicken BowlSteak BowlChicken BurritoSteak Bow... | [Roasted Chili Corn Salsa, [Rice, Black Beans,... | 139.00 |
| 691 | 11 | Chicken BurritoChicken Salad BowlSteak Burrito... | [Tomatillo Red Chili Salsa, [Rice, Cheese, Sou... | 118.25 |
| 1786 | 20 | Chicken BowlCarnitas BurritoChicken BowlChicke... | [Fresh Tomato Salsa, Rice][Fresh Tomato Salsa,... | 114.30 |
해당 부분에서 중요한 포인트는 drop_duplicates 함수이다. 주어진 열을 통해 해당 열의 값이 중복인 요소들을 지워준다. item_name과 order_id를 하나의 세트로 둘중 하나라도 다르면 다른행으로 보기 때문에 제거하진 않는다.
# “Veggie Salad Bowl”이 몇 번 주문되었는지를 계산합니다.
chipo_salad = chipo[chipo['item_name'] == "Veggie Salad Bowl"]
chipo_salad = chipo_salad.drop_duplicates(['item_name', 'order_id']) # 한 주문 내에서 중복 집계된 item_name을 제거합니다.

print(len(chipo_salad))
chipo_salad.head(5)
18
| order_id | quantity | item_name | choice_description | item_price | |
|---|---|---|---|---|---|
| 186 | 83 | 1 | Veggie Salad Bowl | [Fresh Tomato Salsa, [Fajita Vegetables, Rice,... | 11.25 |
| 295 | 128 | 1 | Veggie Salad Bowl | [Fresh Tomato Salsa, [Fajita Vegetables, Lettu... | 11.25 |
| 455 | 195 | 1 | Veggie Salad Bowl | [Fresh Tomato Salsa, [Fajita Vegetables, Rice,... | 11.25 |
| 496 | 207 | 1 | Veggie Salad Bowl | [Fresh Tomato Salsa, [Rice, Lettuce, Guacamole... | 11.25 |
| 960 | 394 | 1 | Veggie Salad Bowl | [Fresh Tomato Salsa, [Fajita Vegetables, Lettu... | 8.75 |
item_name이 Chicken Bowl인 행만 먼저 걸러냅니다. 그 후 order_id를 기준으로 해당 프레임을 그룹화한 뒤 그룹별 데이터를 모두 합칩니다. 합쳐진 데이터에서 quantity 열 값이 2보다 큰 행들을 모두 고릅니다.
# “Chicken Bowl”을 2개 이상 주문한 고객들의 "Chicken Bowl" 메뉴의 총 주문 수량을 구합니다.
chipo_chicken = chipo[chipo['item_name'] == "Chicken Bowl"]
chipo_chicken_ordersum = chipo_chicken.groupby('order_id').sum()['quantity']
chipo_chicken_result = chipo_chicken_ordersum[chipo_chicken_ordersum >= 2]

print(len(chipo_chicken_result))
chipo_chicken_result.head(5)
114
order_id
1004    2
1023    2
1072    2
1078    2
1091    2
Name: quantity, dtype: int64
댓글